
Natural Sciences and Engineering Research Council of Canada
www.nserc-crsng.gc.ca
Common menu bar links
Departmental Performance Report (DPR)
2012-13
Table of Contents
Section I: Organizational Overview
- Raison d'être
- Responsibilities
- Strategic Outcome(s) and Program Alignment Architecture PAA (2012-13)
- Risk Analysis
- Summary of Performance
- Performance Summary Table for Strategic Outcome and Programs ($ millions)
- Expenditure Profile
Section II: Analysis of Programs and Sub-Programs by Strategic Outcome(s)
- Strategic Outcome - People: Highly skilled science and engineering professionals in Canada
- Performance Analysis
- Program 1.1: Promote Science and Engineering
- Program 1.2: Support Students and Fellows
- Program 1.3: Attract and Retain Faculty
- Strategic Outcome - Discovery: High-quality Canadian-based competitive research in the natural sciences and engineering
- Program 2.1: Fund Basic Research
- Program 2.2: Support for Research Equipment and Major Resources
- Strategic Outcome - Innovation: Knowledge and skills in the natural sciences and engineering are transferred to and used productively by the user sector in Canada
- Program 3.1: Fund Research in Strategic Areas
- Program 3.2: Fund University-Industry-Government Partnerships
- Program 3.3: Support Commercialization
- Program 4.1: Internal Services
Section III: Supplementary Information
- Financial Statements Highlights
- Supplementary Information Tables
- Tax Expenditures and Evaluations Report
Section IV: Other Items of Interest
Minister's Message
I am pleased to report on the Industry Portfolio's key activities for 201213.
During this period, the Portfolio continued to develop and recruit leading research talent through programs administered by the federal granting councils. It also took significant steps to improve commercialization outcomes through the transformation of the National Research Council Canada into an industry-focused research and technology organization. This was complemented by reinvestments in programs such as the College and Community Innovation Program and the Centres of Excellence for Commercialization and Research.
In 201213, the Natural Sciences and Engineering Research Council of Canada (NSERC) continued to support Canadian scientists and engineers who consistently excel as global leaders on international research collaborations. The Council continued to engage colleges and universities that play key roles in Canada's innovation system, while actively seeking feedback from partners in the research and business communities. NSERC also contributed to Canada's competitive advantage by supporting more strategic partnerships with the private sector and training more graduates in the skills needed to support the Canadian economy.
Moving forward, the Industry Portfolio will continue to exercise fiscal responsibility while delivering on government priorities to support jobs and economic growth. Portfolio agencies will continue to play key roles in encouraging collaboration between the research community and the private sector; strengthening the manufacturing sector to sustain and attract globally competitive industries; and bringing forward the government's response to the Review of Aerospace and Space Programs and Policies to maintain Canada's leadership position in those areas.
It is my pleasure to present the 201213 Departmental Performance Report for the Natural Sciences and Engineering Research Council of Canada.
James Moore
Minister of Industry
Message from the Minister of State (Science and Technology)

Science, technology and innovation not only are at the very foundation of Canada's thriving knowledge economy but also are deeply anchored in the competitive global markets of the world today. When countries have the innovative minds capable of ideas that revolutionize the way we see and do things, there is increased wealth and growth. It is with this vision that our government has taken significant actions over the last year to foster and strengthen Canada's culture of innovation. Strategic measures were taken in basic and applied research across sectors. These measures are in alignment with our government's objectives to build an efficient and competitive marketplace, a healthy and innovative knowledge-based economy, and a competitive and sustainable business communityall of which will help position Canada as a leader of ideas in a thriving global economy.
To put Canada on the path to success, our government leveraged past investments, developed and recruited to Canada world-leading research talent, and further encouraged private sector support of research, development and innovation. Efforts included strategic initiatives to improve commercialization outcomes through the refocused National Research Council Canada; a pilot program to help small and medium-sized enterprises access research and business development services; investments to support the development of clean technologies; and funding to support partnerships between post-secondary institutions and industry. These efforts will encourage the conditions that support growth and job creation and will help ensure Canada's long-term prosperity for future generations.
In 201213, the Government of Canada, through the Natural Sciences and Engineering Research Council of Canada (NSERC), maintained its support for university and college collaborations with significant industry investments made in research and development at the regional and community levels across the country because we understand that partnerships are key to bringing more ideas to fruition and into the marketplace. NSERC provided Canadian scientists and engineers with the resources to push the boundaries of research and innovation and to develop our next generation of highly skilled talent. We will continue to strengthen Canada's position in the global science and technology community and keep our country on the cutting edge of innovation well into the future.
We are committed, in the year ahead, to pursuing our goal of building and reinforcing partnerships between research and business communities for the benefit of our country. Where there is innovation, there is job creation, growth, prosperity and an improved quality of life not only for the Canadians of today but also for the Canadians of tomorrow.
Greg Rickford
Minister of State (Science and Technology) (Federal Economic Development Initiative for Northern Ontario)
Section I: Organizational Overview
Raison d'être
The Natural Sciences and Engineering Research Council of Canada (NSERC) is a key actor in making Canada a leading country of discovery and innovation. NSERC aims to maximize the value of public investments in research and development (R&D) and to advance the prosperity and quality of life of all Canadians.
In today's highly competitive knowledge economies, NSERC plays a key role in Canada's innovation ecosystem. NSERC supports research that pushes the boundaries of knowledge. By connecting this innovative research to industry through its partnership initiatives, NSERC also makes it easier for the private sector to collaborate with academia and access the wealth of resources Canada's first-rate academic system has to offer.
NSERC develops the next generation of talented scientists and engineers through its scholarships and research stipends, and increases the visibility of Canadian research.
Responsibilities
NSERC is a departmental corporation of the Government of Canada created in 1978. It is funded directly by Parliament and reports to it through the Minister of Industry. NSERC's Council is composed of the President and up to 18 other distinguished members selected from the private and public sectors. The elected Vice-President is the Chair of Council and of its Executive Committee. The Council is advised on policy matters by various standing committees. The President of NSERC is the Chief Executive Officer. Funding decisions are approved by the President on the basis of recommendations made by peer review committees.
Over the course of the 2012-13 fiscal year, NSERC invested over $1 billion in postsecondary research and training in the Natural Science and Engineering (NSE). NSERC's budget represents 10 percent of the federal government's expenditures on science and technology (S&T), and 20 percent of all university R&D funding in the NSE.
Mandate
The functions of NSERC, based on the authority and responsibility assigned to it under the Natural Sciences and Engineering Research Council Act (1976-1977, c.24), are to:
- promote and assist research in the natural sciences and engineering, other than the health sciences; and
- advise the Minister in respect of such matters relating to such research as the Minister may refer to the Council for its consideration.
NSERC's Governance Structure1
Strategic Outcome(s) and Program Alignment Architecture (PAA) (2012-13)
1.0 People Highly skilled science and engineering professionals in Canada |
2.0 Discovery High quality Canadian-based competitive research in the natural sciences and engineering |
3.0 Innovation Knowledge and skills in the natural sciences and engineering are transferred to and used productively by the user sector in Canada |
|---|---|---|
| Programs | ||
| 1.1 Promote Science and Engineering | 2.1 Fund Basic Research | 3.1 Fund Research in Strategic Areas |
|
Sub-Programs 1.1.1 PromoScience 1.1.2 Prizes |
Sub-Programs 2.1.1 Discovery Grants 2.1.2 Special Research Opportunity Grants |
Sub-Programs 3.1.1 Strategic Partnerships 3.1.2 Collaborative Health Research Projects* |
| 1.2 Support Students and Fellows | 2.2 Support for Research Equipment and Major Resources | 3.2 Fund University-Industry-Government Partnerships |
|
Sub-Programs 1.2.1 Undergraduate Student Research Awards 1.2.2 NSERC Postgraduate Scholarships 1.2.3 Alexander Graham Bell Canada Graduate Scholarships* 1.2.4 Vanier Canada Graduate Scholarships* 1.2.5 Postdoctoral Fellowships 1.2.6 Banting Postdoctoral Fellowships* 1.2.7 Collaborative Research and Training Experience |
Sub-Programs 2.2.1 Research Tools and Instruments Grants 2.2.2 Major Resources Support Grants |
Sub-Programs 3.2.1 Industrial Research and Development Internships* 3.2.2 Industrial Research and Development Fellowships 3.2.3 Industrial Research Chairs 3.2.4 Collaborative Research and Development Grants 3.2.5 Networks of Centres of Excellence* 3.2.6 Business-Led Networks of Centres of Excellence* |
| 1.3 Attract and Retain Faculty | 3.3 Support Commercialization | |
|
Sub-Programs 1.3.1 Canada Excellence Research Chairs* 1.3.2 Canada Research Chairs* 1.3.3 University Faculty Awards |
Sub-Programs 3.3.1 Idea to Innovation Program 3.3.2 College and Community Innovation Program* 3.3.3 Centres of Excellence for Commercialization and Research* |
|
| The following program supports all strategic outcomes within NSERC | ||
| 4.1 Internal Services | ||
|
Sub-Programs
|
||
| * Programs involving two or more of the federal granting agencies (NSERC, Canadian Institutes of Health Research [CIHR], Canada Foundation for Innovation, Social Sciences and Humanities Research Council [SSHRC]). | ||
Organizational Priorities
| Priority | Type2 | Strategic Outcome(s) |
|---|---|---|
| People Advantage: Inspire new generations of students to pursue careers in science and engineering, and provide them with the means to develop their full potential. | Ongoing |
|
| Summary of Progress | ||
What progress has been made towards this priority?
|
||
| Priority | Type | Strategic Outcome(s) |
|---|---|---|
| Knowledge Advantage: Lead the advancement of knowledge in science and engineering, and ensure that Canadian scientists and engineers are leaders and key players in a global knowledge community. | Ongoing |
|
| Summary of Progress | ||
|
What progress has been made towards this priority?
|
||
| Priority | Type | Strategic Outcome(s) |
|---|---|---|
| Entrepreneurial Advantage: Connect and apply the strength of the academic research system to addressing the opportunities and challenges of building prosperity for Canada. | Ongoing |
|
| Summary of Progress | ||
|
What progress has been made towards this priority?
|
||
| Priority | Type | Strategic Outcome(s) |
|---|---|---|
| Accountability: Demonstrate NSERC's accountability and how the results of its investments in Canadian research and training benefit Canadians. | Ongoing |
|
| Summary of Progress | ||
|
What progress has been made towards this priority?
|
||
Risk Analysis
| Risks | Risk Response Strategy | Link to Program Alignment Architecture | Link to Organizational Priorities |
|---|---|---|---|
| 1) Budget Management The risk that the organization is ineffective in managing and monitoring the grants and operational budgets and in making informed/accurate resource related decisions. |
This risk was previously identified in the 2012-13 Report on Plans and Priorities. Controls and activities that were already in place to mitigate against this risk included:
Additional mitigation controls and activities that were developed in 2012-13 include the following measures aligned with Treasury Board guidelines:
NSERC also developed resource management training modules for budget holders and provided senior management with access to Financial Management Advisors to provide professional and strategic financial advice on resource management. NSERC also conducted a policy review compliance assessment against Treasury Board Secretariat policies in 2012-13. |
|
|
| 2) Leveraging Information Technology Innovation The risk that the organization does not adequately leverage its investments in new technology to become more efficient and offer better services to the Natural Sciences and Engineering community. |
This risk was previously identified in the 2012-13 Report on Plans and Priorities. Mitigation controls and activities that were already in place included:
Additional mitigation activities were undertaken in 2012-13. These activities included:
Strong governance is in place to support the implementation of the Research Portal. An Innovation Change Management Working Group is in place to harmonize processes, obtain feedback on changes proposed and communicate the implementation schedule. |
|
|
Summary of Performance
| Total Budgetary Expenditures (Main Estimates) 201213 | Planned Spending 2012-13 | Total Authorities (available for use) 201213 | Actual Spending (authorities used) 2012-13 | Difference (Planned vs. Actual Spending) |
|---|---|---|---|---|
| 1,046.6 | 1,049.6 | 1,080.2 | 1,076.0 | 26.4 |
| Note: The difference in planned and actual spending and FTEs reflects the implementation of changes announced in Budget 2012. | ||
| Planned 2012-13 | Actual 2012-13 | Difference 2012-13 |
|---|---|---|
| 388 | 380 | -8 |
Performance Summary Table for Strategic Outcome and Programs ($ millions)3
Strategic Outcome 1: Highly skilled science and engineering professionals in Canada
| Program | Total Budgetary Expenditures (Main Estimates 201213) | Planned Spending | Total Authorities (available for use) 201213 | Actual Spending (authorities used) | Alignment to Government of Canada Outcomes | ||||
|---|---|---|---|---|---|---|---|---|---|
| 201213 | 201314 | 201415 | 2012134 | 2011-12 | 2010-11 | ||||
| 1.1 Promote Science and Engineering | 5.8 | 5.8 | 8.6 | 8.6 | 5.8 | 5.1 | 5.2 | 11.9 | |
| 1.2 Support Students and Fellows | 141.8 | 141.8 | 141.1 | 141.0 | 142.3 | 140.3 | 144.1 | 153.8 | |
| 1.3 Attract and Retain Faculty | 153.0 | 153.0 | 136.7 | 136.7 | 145.3 | 135.2 | 137.2 | 161.1 | |
| Strategic Outcome 1 Sub-Total |
300.6 | 300.6 | 286.4 | 286.3 | 293.4 | 280.6 | 286.5 | 326.8 | |
Strategic Outcome 2: High-quality Canadian-based competitive research in the natural sciences and engineering5
| Program | Total Budgetary Expenditures (Main Estimates 201213) | Planned Spending | Total Authorities (available for use) 201213 | Actual Spending (authorities used) | Alignment to Government of Canada Outcomes | ||||
|---|---|---|---|---|---|---|---|---|---|
| 201213 | 201314 | 201415 | 2012136 | 2011-12 | 2010-11 | ||||
| 2.1 Fund Basic Research | 366.6 | 366.6 | 374.5 | 374.2 | 374.1 | 369.8 | 357.5 | 369.1 | |
| 2.2 Support for Research Equipment and Major Resources | 37.1 | 37.1 | 18.2 | 18.2 | 35.4 | 60.77 | 66.4 | 71.0 | |
| Strategic Outcome 2 Sub-Total |
403.7 | 403.7 | 392.7 | 392.4 | 409.5 | 430.5 | 423.9 | 440.1 | |
Strategic Outcome 3: Knowledge and skills in the natural sciences and engineering are transferred to and used productively by the user sector in Canada8
| Program | Total Budgetary Expenditures (Main Estimates 201213) | Planned Spending | Total Authorities (available for use) 201213 | Actual Spending (authorities used) | Alignment to Government of Canada Outcomes | ||||
|---|---|---|---|---|---|---|---|---|---|
| 201213 | 201314 | 201415 | 2012139 | 2011-12 | 2010-11 | ||||
| 3.1 Fund Research in Strategic Areas | 106.6 | 106.6 | 106.1 | 106.1 | 109.2 | 101.4 | 107.7 | 108.1 | |
| 3.2 Fund University-Industry-Government Partnerships | 168.8 | 171.8 | 190.8 | 190.8 | 189.1 | 185.4 | 184.7 | 122.0 | |
| 3.3 Support Commercialization | 42.9 | 42.9 | 50.0 | 45.7 | 52.4 | 50.9 | 58.0 | 53.1 | |
| Strategic Outcome 3 Sub-Total |
318.3 | 321.3 | 346.9 | 342.6 | 350.7 | 337.7 | 350.4 | 283.2 | |
Performance Summary Table for Internal Services ($ millions)
| Program | Total Budgetary Expenditures (Main Estimates 201213) | Planned Spending | Total Authorities (available for use) 201213 | Actual Spending (authorities used) | ||||
|---|---|---|---|---|---|---|---|---|
| 201213 | 201314 | 201415 | 201213 | 2011-12 | 2010-11 | |||
| 24.0 | 24.0 | 24.1 | 24.1 | 26.6 | 27.2 | 25.0 | 25.8 | |
| Sub-Total | 24.0 | 24.0 | 24.1 | 24.1 | 26.6 | 27.2 | 25.0 | 25.8 |
Total Performance Summary Table ($ millions)
| Strategic Outcome(s) and Internal Services | Total Budgetary Expenditures (Main Estimates 201213) | Planned Spending | Total Authorities (available for use) 201213 | Actual Spending (authorities used) | ||||
|---|---|---|---|---|---|---|---|---|
| 201213 | 201314 | 201415 | 201213 | 2011-12 | 2010-11 | |||
| People | 300.6 | 300.6 | 286.4 | 286.3 | 293.4 | 280.6 | 286.5 | 326.8 |
| Discovery | 403.7 | 403.7 | 392.7 | 392.4 | 409.5 | 430.5 | 423.9 | 440.1 |
| Innovation | 318.3 | 321.3 | 346.9 | 342.6 | 350.7 | 337.7 | 350.4 | 283.2 |
| Internal Services | 24.0 | 24.0 | 23.8 | 23.8 | 26.6 | 27.2 | 25.0 | 25.8 |
| Total | 1,046.6 | 1,049.6 | 1,049.8 | 1,045.1 | 1,080.2 | 1,076.0 | 1,085.8 | 1,075.9 |
The spending figures presented in this table may not match figures included in previous reports due to changes made to the Program Alignment Architecture (PAA) in 2012-13 that are being implemented for the first time in fiscal year 2013-14. These changes involve a reorganization of programs in NSERC's new PAA structure.
Note: Planned spending for future years does not include investments announced in Budget 2013.
Expenditure Profile
Departmental Spending Trend
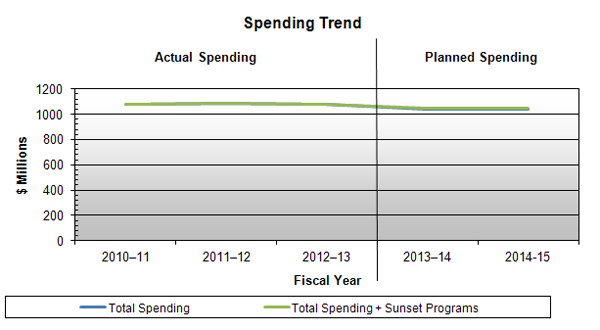
Source: NSERC
Spending Trend - NSERC
Note: Planned spending does not include investments announced in Budget 2013. Sun setting programs that NSERC currently has are the Canada-India Network of Centres of Excellence (sunsets in 2016-17, $1.8M) and the Climate Change and Atmospheric Research Fund (sunsets in 2016-17, $6M).
Estimates by Vote
For information on NSERC's organizational Votes and/or statutory expenditures, please see the ![]() Public Accounts of Canada 2013 (Volume II). An electronic version of the
Public Accounts of Canada 2013 (Volume II). An electronic version of the ![]() Public Accounts 2013
ii is available on the Public Works and Government Services Canada Web site.
Public Accounts 2013
ii is available on the Public Works and Government Services Canada Web site.
Section II: Analysis of Programs and Sub-Programs by Strategic Outcome(s)
Strategic Outcome - People: Highly skilled science and engineering professionals in Canada
| Strategic Outcome 1.0: Highly skilled science and engineering professionals in Canada | ||
|---|---|---|
| Performance Indicators | Targets | Actual Results |
Total researchers per thousand employed relative to other OECD countries. |
Maintain top 10 world ranking |
Canada's world ranking was 16th in 2011(most recent data available). |
Employment rate of university graduates in the natural sciences and engineering vs. general population |
NSE unemployment rate less than rate for general population by at least 1 percentage point |
Unemployment rate of 3.3% (versus 7.2% unemployment rate for the general population) in 2012. |
Performance Analysis
Canada ranks 16th in the total number of researchers per thousand employed relative to other OECD countries (Figure 2.0). The unemployment rate for university graduates in natural sciences and engineering (NSE) fields continues to remain well below the general unemployment rate, which sits at more than twice the unemployment rate for NSE university graduates in 2012-13 (Figure 2.1).
Other labour market outcomes for university graduates in the natural sciences and engineering also provide evidence for the positive outcomes of NSERC-funded students. Employment opportunities in natural sciences and engineering have continued to grow as the natural science and engineering labour force reached 1.2 million in 2012-13, continuing to be the fastest growing occupational group in Canada over the past 20 years. Furthermore, the average annual salaries for natural sciences and engineering professions in 2012-13 were 31.3% over the national average for all occupations and second only to the average annual salaries for management occupations (Figure 2.1)
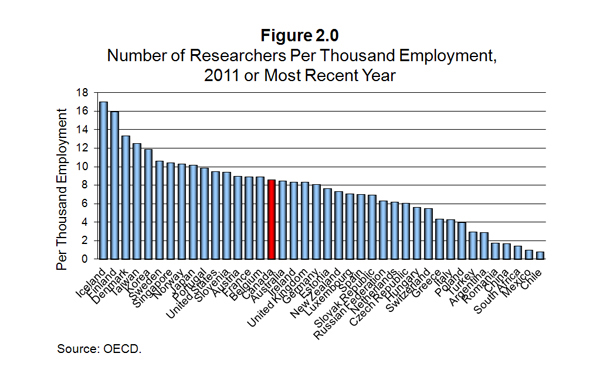
Number of Researchers Per Thousand Employment, 2011 or Most Recent Year

Labour Force Outcomes for Natural Scientists and Engineers (NSE)
Program 1.1: Promote Science and Engineering
| Total Budgetary Expenditures (Main Estimates) 201213 |
Planned Spending 201213 |
Total Authorities (available for use) 201213 |
Actual Spending (authorities used) 201213 |
Difference10 201213 |
|---|---|---|---|---|
| 5.8 | 5.8 | 5.8 | 5.1 | -0.7 |
| Planned 2012-13 |
Actual 2012-13 |
Difference 2012-13 |
|---|---|---|
| 1 | 1 | 0 |
| Expected Results | Performance Indicators | Targets | Actual Results |
|---|---|---|---|
| Student interest in research in the sciences, math and engineering is encouraged. | Percentage of science promotion projects that successfully complete the planned activity. | Greater than 80 percent. | 92 percent |
Performance Analysis and Lessons Learned
Promoscience: In 2012-13, the PromoScienceiii competition awarded 37 projects. NSERC has continued to consider outreach to groups that are traditionally under-represented in science and engineering such as women and Aboriginals, in its selection process.
During the 2012-13 competition, NSERC funded 10 out of 17 proposals from organizations that reach out to Aboriginals or that focused their proposal on programs for groups that are under-represented in science and engineering.
NSERC Awards for Science Promotion: Along with the Promoscience Grants, NSERC's Awards for Science Promotioniv honour individuals and groups who make an outstanding contribution to the promotion of science in Canada by encouraging popular interest in science or helping youth to develop science abilities. The profiles of the 2012 individual and group winners are presented below.
Dr. Thomas Keenan
The recipient of a 2012 NSERC Award for Science Promotion, University of Calgary professor Thomas Keenan has inspired and informed his students, colleagues and the public to care deeply about science and to ask probing questions. For 24 years (1984-2008), he provided promising high school students hands-on learning experiences related to science. His work has encouraged countless young Canadians to pursue a life and career in science and technology.
As an educator, broadcaster, technology journalist and public speaker, Dr. Keenan has promoted science and technology to the masses through regular columns in newspapers and magazines, as well as radio and television appearances. His clear explanations about computer security, the social implications of technology, and the use of technology in education help people understand the issues, root causes, and how their lives and society may be affected.
Tomatosphere
The winning organization for the 2012-13 NSERC Award for Science Promotion was the Tomatosphere Project - a national science project where youth conduct real scientific experiments with tomato seeds previously taken into space. Since 2001, Tomatosphere has provided over two million students from grades 2 to 10 with a unique opportunity to learn about science and space by performing real research in their classrooms. Through these experiments, students learn about how the elements of life support requirements for space missions–food, water, oxygen and carbon dioxide consumption. Students also explore how food grows in different environments and the effects of space travel. Results from all the experiments are used by Canadian scientists to help understand some of the issues related to agriculture and long-term space travel.
For more information on Tomatosphere and Dr.Thomas Keenan, please consult the Current Winners page.
Promoting the participation of women in science and engineering: In 2012-13, NSERC became involved in the ![]() Gender Summit 3 North Americav to build upon the momentum of the Summit "Maximizing Opportunities, Increasing Women's Participation in Science and Engineeringvi" hosted by NSERC in November 2010. The Gender Summit 3 North America is a partnership between the
Gender Summit 3 North Americav to build upon the momentum of the Summit "Maximizing Opportunities, Increasing Women's Participation in Science and Engineeringvi" hosted by NSERC in November 2010. The Gender Summit 3 North America is a partnership between the ![]() National Science Foundationvii (NSF), the
National Science Foundationvii (NSF), the ![]() National Institutes of Healthviii (NIH) in the US, the
National Institutes of Healthviii (NIH) in the US, the ![]() Consejo Nacional de Ciencia y Tecnologíaix (CONACYT) in Mexico, the
Consejo Nacional de Ciencia y Tecnologíaix (CONACYT) in Mexico, the ![]() Canadian Institutes of Health Researchx (CIHR) and NSERC in Canada.
Canadian Institutes of Health Researchx (CIHR) and NSERC in Canada.
The three-day Summit is planned for November 2013 under the theme "Diversity Fueling Excellence in Research and Innovation". The overall aim of the event is a Call to Action to relevant stakeholders to make positive change towards achieving greater diversity and leadership in the science workforce, and towards greater inclusion of gender considerations in research content and in the research process.
Program 1.2: Support Students and Fellows
| Total Budgetary Expenditures (Main Estimates) 201213 |
Planned Spending 201213 |
Total Authorities (available for use) 201213 |
Actual Spending (authorities used) 201213 |
Difference 201213 |
|---|---|---|---|---|
| 141.8 | 141.8 | 142.3 | 140.3 | -1.5 |
| Planned 2012-13 |
Actual 2012-13 |
Difference 2012-13 |
|---|---|---|
| 32 | 28 | -4 |
| Expected Results | Performance Indicators | Targets | Actual Results |
|---|---|---|---|
| A supply of highly-qualified Canadians with leading-edge scientific and research skills for Canadian industry, government and universities. | Average degree completion rates among NSERC award recipients vs. general NSE student population. | Completion rate 10 percent greater than NSE student population. | Completion rate was 15 percent greater than NSE student population. |
| Percentage of student population supported through scholarships in the NSE. | Greater or equal to 10% of student population supported. | NSERC supported 15% of university NSE students. |
Performance Analysis and Lessons Learned
Banting Postdoctoral Fellowships: In 2012-13, NSERC collaborated with the Social Sciences and Humanities Research Council (SSHRC), the Canadian Institutes of Health Research (CIHR), the Department of Foreign Affairs and International Trade, and universities to broaden the ![]() Banting Postdoctoral Fellowshipsxi and
Banting Postdoctoral Fellowshipsxi and ![]() Vanier Canada Graduate Scholarshipsxii programs' reach to more of their intended audiences abroad. In 2012-13, foreign applicants to the Banting and Vanier programs accounted for 37% of all applicants. A sub-group of these applicants were recent immigrants to Canada. Over the reporting period, incremental efforts to market the programs abroad have been designed and are currently being implemented to build on Canada's wealth of knowledge, through sharing experience and expertise.
Vanier Canada Graduate Scholarshipsxii programs' reach to more of their intended audiences abroad. In 2012-13, foreign applicants to the Banting and Vanier programs accounted for 37% of all applicants. A sub-group of these applicants were recent immigrants to Canada. Over the reporting period, incremental efforts to market the programs abroad have been designed and are currently being implemented to build on Canada's wealth of knowledge, through sharing experience and expertise.
During the 2012-13 Banting competition, NSERC received 180 eligible applications for fellowships in natural sciences and engineering fields. Forty of these applications met the program's funding criteria and a total of 23 awards were offered to top-tier postdoctoral fellows to conduct research in natural sciences and engineering areas. Twenty-six percent of the grantees were Canadians who will carry out research at a foreign host institution, while thirty-nine percent were foreign citizens who will carry out research in Canada.
Collaborative Research and Training Experience Program: The industrial stream of the Collaborative Research and Training Experience Programxiii (CREATE) program was created in 2011 to support NSERC's ![]() Strategy for Partnerships and Innovationxiv and to enhance linkages between industry and academia through an increased supply of highly qualified personnel with the professional skills desired by industry. NSERC is contributing to
Strategy for Partnerships and Innovationxiv and to enhance linkages between industry and academia through an increased supply of highly qualified personnel with the professional skills desired by industry. NSERC is contributing to ![]() Canada's People Advantagexv by increasing the supply of highly qualified personnel who are "employer-ready" and can generate immediate results after graduation through programs like CREATE, which focus on developing skills and providing experience that are useful for a more effective and productive transition to the workplace, improve job readiness and provide immediate benefits to industrial employers. More than half of the proposals funded by the CREATE program during the 2012 competition had an industrial stream component.
Canada's People Advantagexv by increasing the supply of highly qualified personnel who are "employer-ready" and can generate immediate results after graduation through programs like CREATE, which focus on developing skills and providing experience that are useful for a more effective and productive transition to the workplace, improve job readiness and provide immediate benefits to industrial employers. More than half of the proposals funded by the CREATE program during the 2012 competition had an industrial stream component.
NSERC has continued to explore opportunities for alignment of the Collaborative Research and Training Experience program with programs that support student mobility in other countries, following the model of the 2011 agreement with the ![]() German Research Foundationxvi (DFG). For the 2013 competition, the program received four applications for collaborations with the DFG.
German Research Foundationxvi (DFG). For the 2013 competition, the program received four applications for collaborations with the DFG.
In 2012-13, NSERC also signed an agreement to promote student mobility with the ![]() São Paulo Research Foundationxvii in Brazil (FAPESP).
São Paulo Research Foundationxvii in Brazil (FAPESP).
In its first three years, CREATE has supported more than 2,400 students and postdoctoral fellows through funding and training in 90 active CREATE initiatives. In 2011, the number of trainees receiving CREATE funds totalled 357 students.
Program Evaluation: Undergraduate Student Research Awards
An evaluation of NSERC's Undergraduate Student Research Awards (USRA) program was completed in November 2012. The evaluation found that the program is addressing an important need in the research community and continues to be relevant to Canada's priorities in R&D and science and technology. The USRA program primarily contributes to Canada's supply of highly qualified personnel by promoting students' interest in research through first time exposure to the research environment. The program adds significant value to the students' undergraduate education by providing them with relevant skills and experiences. In some instances, the program influences students to change their educational and career plans.
The evaluation confirmed that the USRA program complements rather than duplicates other undergraduate research awards programs in Canada, since other programs have a more narrow focus and are smaller in scale.
The evaluation also found that USRA supervisors at both universities and companies experienced increased productivity through their interaction with USRA holders as an unintended outcome of the program. Participating companies also reported that the program helped them recruit new employees and that the USRA award made students more "job-ready" for employment in industry.
Program Evaluation: Postdoctoral Fellowships
An evaluation of NSERC's Postdoctoral Fellowships (PDF) was completed in March 2013. The evaluation found that the program is well designed and continues to be relevant and meets an ongoing need.
The postdoctoral experience provided by a fellowship is seen as critical to obtaining employment in academia, particularly for science disciplines. While other sources of postdoctoral support exist in Canada, NSERC's PDF is seen as a prestigious award that offers independent training to the "best and brightest".
PDF recipients are more likely to report significant gains in their overall experience level in their discipline, in their critical and creative thinking and in leadership skills, than unfunded postdoctoral fellows. Most PDF supervisors also report that the PDF fellows supervised had a positive impact on their research productivity.
Evaluation findings point to the positive employment impacts of PDF recipients. The vast majority of funded applicants who completed their fellowship are employed full-time, most often within universities and typically in tenured or tenure track positions. Most are employed in research-intensive positions, and identify both their PhD and their postdoctoral experience as contributing to their employment. Unfunded applicants are less likely to demonstrate the same employment outcomes.
Based on the evaluation's recommendations, NSERC will consult with the community to explore ways to maximize the impacts of PDFs. NSERC is also currently reviewing its timelines and processes in order to be able to announce PDF competition results earlier in future competitions.
Program 1.3: Attract and Retain Faculty
| Total Budgetary Expenditures (Main Estimates) 201213 |
Planned Spending 201213 |
Total Authorities (available for use) 201213 |
Actual Spending (authorities used) 201213 |
Difference 201213 |
|---|---|---|---|---|
| 153.0 | 153.0 | 145.3 | 135.2 | -17.8 11 |
| Planned 2012-13 |
Actual 2012-13 |
Difference 2012-13 |
|---|---|---|
| 10 | 1 | -9 12 |
| Expected Results | Performance Indicators | Targets | Actual Results |
|---|---|---|---|
| Enhanced research capacity in science and engineering. | Number of new, foreign-educated applicants to NSERC's Discovery Grants initiative. | Greater than 100 per year. | 116 |
Performance Analysis and Lessons Learned
Discovery Grants: Research capacity is enhanced by the attraction of top researchers from abroad and is as well dependent on retaining some of the world's most accomplished and promising researchers in Canada. The vast majority of new professors in the natural sciences and engineering in Canada apply to NSERC's largest program, the Discovery Grantsxviii (DG) Program.
The DG initiative helps build Canada's knowledge base by attracting talented researchers from around the world to Canadian universities. In 2012-13, there were 116 new foreign-educated applicants to the DG program who received both their bachelor's and Ph.D. degrees outside the country (Figure 2.2). NSERC also tracks the reasons that DG grantees provide when they terminate their awards before the award end date. The vast majority of professors receiving NSERC support remain in the country during the tenure of their award. The percentage of NSERC-funded professors staying in the country is presented in (Figure 2.3).
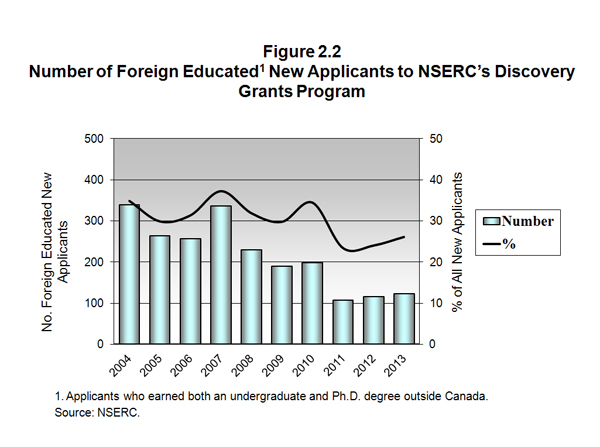
Number of Foreign Educated New Applicants to NSERC's Discovery Grants Program
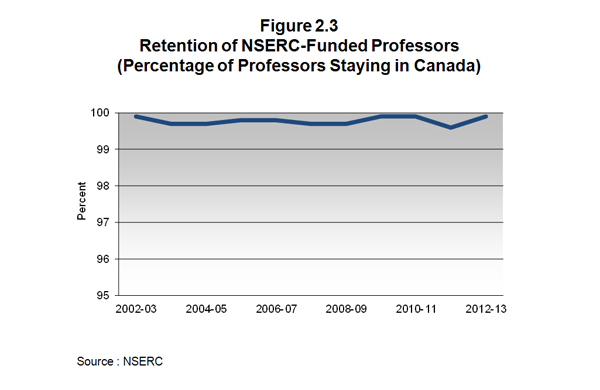
Retention of NSERC-Funded Professors (Percentage of Professors Staying in Canada)
Strategic Outcome - Discovery: High-quality Canadian-based competitive research in the natural sciences and engineering
| Strategic Outcome 2.0: High-quality Canadian-based competitive research in the natural sciences and engineering | ||
|---|---|---|
| Performance Indicators | Targets | Actual Results |
| Average number of times that Canadian papers in the NSE are cited by other researchers (Average Relative Citation [ARC] factor of Canadian publications in the NSE worldwide) | Maintain top 20 world ranking | Canada ranked 17th in 2011 (most recent data available. |
Performance Analysis
One of the first tangible outcomes of an investment in university research is a publication in a scientific or engineering journal. The vast majority of Canada's scientific and engineering publications are produced by university researchers; therefore publications are a good indicator of the immediate outcome of NSERC research funding and can be used to benchmark our performance against the rest of the world.
The high quality and impact of Canadian research is evident in its ranking among top countries on the average number of times Canadian R&D publications are cited by other researchers. Citations are a measure of the potential use of a researcher's work by other researchers.
Based on the number of citations received by scientific papers over the three years following the publication year, a standardized measure called the Average Relative Citation factor (ARC) is calculated for each country and international comparisons made. Based on the most current data available (2011), Canada has maintained its ARC ranking of Canadian publications in the NSE worldwide and is still within the top 20 in the world (Figure 2.4).
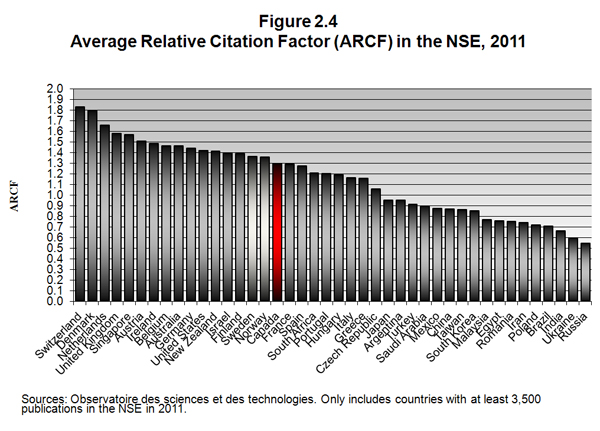
Average Relative Citation Factor (ARCF) in the NSE, 2011
Program 2.1: Fund Basic Research
| Total Budgetary Expenditures (Main Estimates) 201213 |
Planned Spending 201213 |
Total Authorities (available for use) 201213 |
Actual Spending (authorities used) 201213 |
Difference 201213 |
|---|---|---|---|---|
| 366.6 | 366.6 | 374.1 | 369.8 | 3.2 |
| Planned 2012-13 |
Actual 2012-13 |
Difference 2012-13 |
|---|---|---|
| 56 | 53 | -3 |
| Expected Results | Performance Indicators | Targets | Actual Results |
|---|---|---|---|
| The discovery, innovation and training capability of university researchers in natural sciences and engineering is enhanced by the provision of support for ongoing programs of basic research. | World ranking in number of NSE publications. | Maintain top 10 world ranking. | Canada ranked 9th in the most recent data available (2011). |
| Percentage of funds spent on training of students and postdoctoral fellows. | 35 percent | 49 percent |
Performance Analysis and Lessons Learned
Based on the most current data available (2011), Canada remains within the top 10 countries for the number of natural sciences and engineering publications. (Figure 2.5)
Discovery Grants (DG) support ongoing programs of research with long-term goals at Canadian universities. The 2012 DG competition awarded 298 Early-Career Researchers (ECR) with a Discovery Grant and a $5,000 annual supplement resulting from increased funding provided in Budget 2011. NSERC has also retroactively provided ECR grantees from previous competitions in 2009, 2010 and 2011, with annual supplements resulting from the increased funding provided in the Budget 2011.
To be funded through Discovery Grants, researchers must demonstrate research excellence and high productivity, as well as contributions to the training of highly qualified people. Based on the most current data available (2011-12), 49% of the program's expenditures are spent on supporting the training of students at the undergraduate, masters, doctoral and postdoctoral levels, through stipends provided by NSERC-funded professors (Figure 2.6).
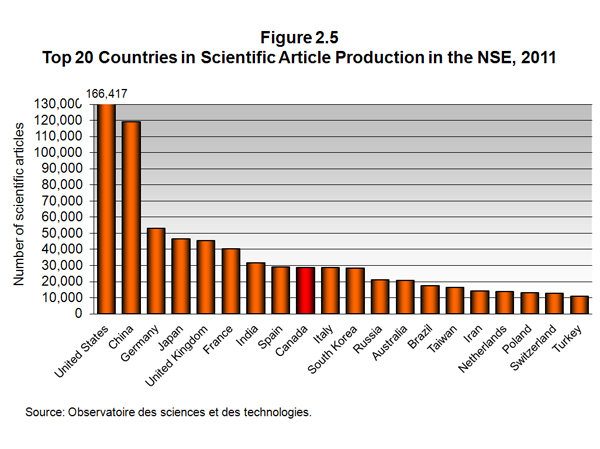
Top 20 Countries in Scientific Article Production in the NSE, 2011
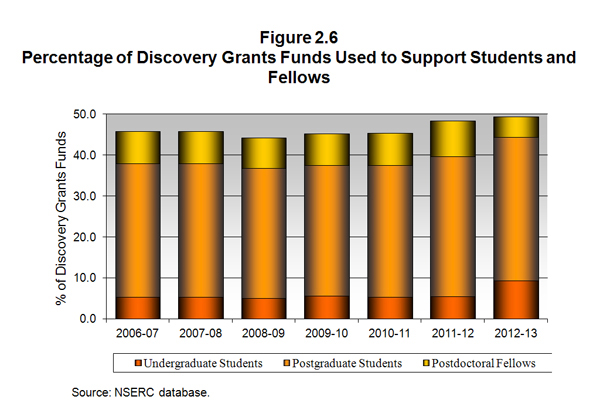
Percentage of Discovery Grants Funds Used to Support Students and Fellows
Discovery Grants Evaluation: A five-year evaluation of the Discovery Grants (DG) Program is currently underway, as part of NSERC's regular program evaluation cycle. This evaluation aims to assess the extent to which the program is meeting its objectives, in light of improvements to the DG program's peer review process in 2009. The program's key objectives are to contribute to promoting and maintaining a diversified base of high-quality research in the natural sciences and engineering at Canadian universities, to fostering research excellence, and to providing a stimulating environment for research training in Canada. The evaluation entails a review of the evaluation results by an international panel of experts.
In 2012-13, NSERC gathered input for the DG evaluation by surveying Discovery Grant holders, applicants, highly qualified personnel, Evaluation Group members, by interviewing Evaluation Group Chairs and seeking feedback from scientific societies and university administrators across the country. A thorough analysis of data, statistics and bibliometric information is also being carried out in support of the evaluation.
Discovery Grants Budget Allocation: In July 2012, the Council of Canadian Academies released the expert panel report: ![]() Informing Research Choices: Indicators and Judgmentxix, in response to a 2009 request from NSERC to inform a review of the method used to allocate the DG program budget among different scientific disciplines.
Informing Research Choices: Indicators and Judgmentxix, in response to a 2009 request from NSERC to inform a review of the method used to allocate the DG program budget among different scientific disciplines.
In 2012-13, NSERC consulted the research community and other stakeholders on the expert panel report through an online survey; invitations to submit input were also sent to 60 different interested groups (scientific societies and university groups), and a round-table discussion with representatives of the research community was organized. The goal of the roundtable discussions was to provide concrete advice on key policy issues and considerations in allocating the budget of the Discovery Grants program among different disciplines. NSERC has gathered initial feedback from its Committee on Grants and Scholarships and the Committee is expected to make further recommendations to NSERC on this matter by the end of 2013.
Climate Change and Atmospheric Research: In 2012-13, NSERC awarded seven projects with more than $32 million in research funding over five years through the new Climate Change and Atmospheric Researchxx (CCAR) initiative. The funding will support teams of university researchers, scientists and partner organizations who will work together to advance our understanding of climate and the risks related to climate change. CCAR-funded projects include: (1) Addressing Key Uncertainties in Remote Canadian Environments by the Network on Climate and Aerosols (NETCARE), (2) research related to the Polar Environment Atmospheric Research Laboratory (PEARL) on Probing the Atmosphere of the High Arctic, (3) a Biogeochemical and Tracer Study of a Rapidly Changing Arctic Ocean Canadian Arctic by the GEOTRACES Program, (4) a project on Ventilation, Interactions and Transports Across the Labrador Sea (VITALS), (5) a project by the Canadian Sea Ice and Snow Evolution (CanSISE) Network, (6) the Canadian Network for Regional Climate and Weather Processes, and the (7) Changing Cold Regions Network (CCRN).
Keeping Cars in Their Own Lane
Robert Laganière of the University of Ottawa is designing surveillance systems that could alert drivers when they fall asleep and sound an alarm when the car drifts into the wrong lane or is at risk of hitting an obstacle.
His research uses artificial intelligence in video surveillance systems that can recognize and interpret the images recorded. Cameras looking at the road would recognize lane markings and alert drivers when they stray. A camera looking at the car's periphery would detect the presence of vehicles inside the car's blind spot. A backup camera would detect obstacles during reverse manoeuvres. Cameras inside the vehicle would study the driver's face for signs of fatigue. He is currently working on an NSERC Collaborative project with CogniVue, an Ottawa-based company that supplies image-recognition solutions to the automotive industry.
Program 2.2: Support for Research Equipment and Major Resources
| Total Budgetary Expenditures (Main Estimates) 201213 |
Planned Spending 201213 |
Total Authorities (available for use) 201213 |
Actual Spending (authorities used) 201213 |
Difference 201213 |
|---|---|---|---|---|
| 37.1 | 37.1 | 35.4 | 60.7 | 23.6 |
| Planned 2012-13 |
Actual 2012-13 |
Difference 2012-13 |
|---|---|---|
| 10 | 10 | 0 |
| Expected Results | Performance Indicators | Targets | Actual Results |
|---|---|---|---|
| The discovery, innovation and training capability of university researchers in the NSE is supported by their access to research equipment and major regional or national research facilities. | Average number of researchers benefiting from equipment awards. | Over 1,000. | 851 |
Performance Analysis and Lessons Learned
In 2012-13, 851 researchers benefited from an NSERC Research Tools and Instruments (RTI) grant. (Figure 2.7).
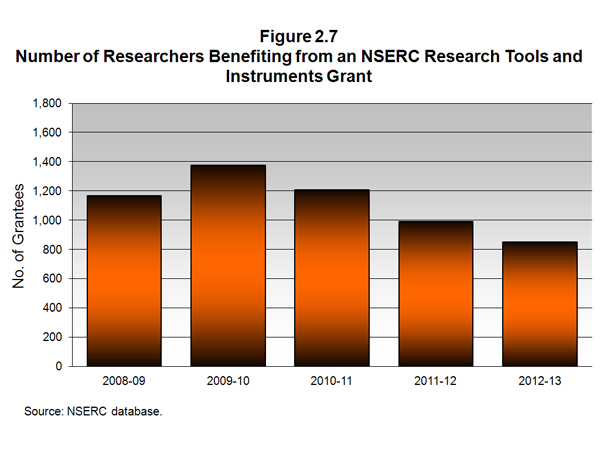
Number of Researchers Benefiting from an NSERC Research Tools and Instruments Grant
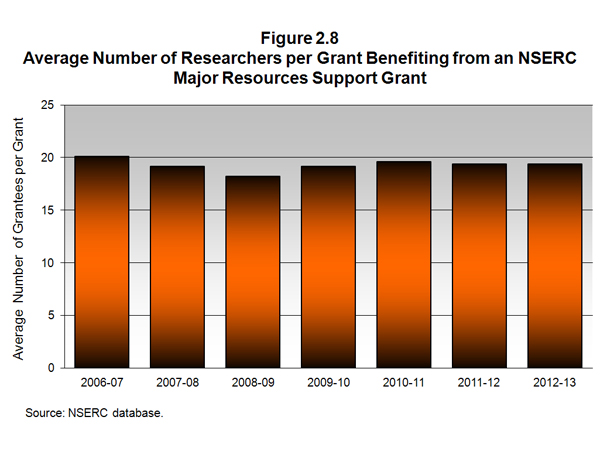
Average Number of Researcher per Grant Benefiting from an NSERC Major Resources Support Grant
In 2012-13, there were 35 active Major Resources Support (MRS) awards. The average number of researchers benefiting from a Major Resources Support grants (MRS) in 2012-13 was 19; the amount was unchanged from the previous year (Figure 2.8).
Research Tools and Instruments: In 2012-13, NSERC consulted with the research community to discuss options for the future of the program. In response to feedback received, starting in 2014-15, the RTI competitions will consider target allocations per institution, as determined through competitive peer-reviewed competitions.
Major Resources Support: Existing commitments are being honored by NSERC and NSERC is currently collaborating with partners, including the ![]() Canada Foundation for Innovationxxi to find ways to effectively leverage support for major national research facilities in Canada.
Canada Foundation for Innovationxxi to find ways to effectively leverage support for major national research facilities in Canada.
To ensure continued operational support for thematic national resources in the fields of Mathematics and Statistics, NSERC launched the initiative Collaborative and Thematic Resources Support in Mathematics and Statisticsxxii (CTRMS) in February 2013. These grants will assist resources that have broad reach and provide significant value in advancing knowledge in mathematics and statistics and related interdisciplinary research. Collaborative and thematic resources will promote national and international interactions within the mathematical and statistical sciences and provide a place where researchers from these fields can meet, collaborate and exchange ideas.
Strategic Outcome - Innovation: Knowledge and skills in the natural sciences and engineering are transferred to and used productively by the user sector in Canada
| Strategic Outcome 3.0: Knowledge and skills in the natural sciences and engineering are transferred to and used productively by the user sector in Canada | ||
|---|---|---|
| Performance Indicators | Targets | Actual Results |
Percentage annual growth in the number of partner companies |
Greater than five percent per year |
11 percent |
Comparison of percentage of HERD funded by industry to OECD countries |
Top quartile ranking |
Canada maintained its top quartile ranking in 2010 (most recent data available) by ranking 7th out of 34 OECD countries. |
Performance Analysis
In 2012-13, there was an 11% growth in the number of companies partnering with NSERC. Since the launch of the Strategy for Partnerships and Innovation in 2009-10, the number of industrial partners participating in NSERC programs has grown steadily every year and reached 2,862 in 2012-13 (Figure 2.9). The majority of the top 100 R&D firms in Canada are currently partners with NSERC. Industrial partners contribute financially to post-secondary research projects, scholarships and fellowships.
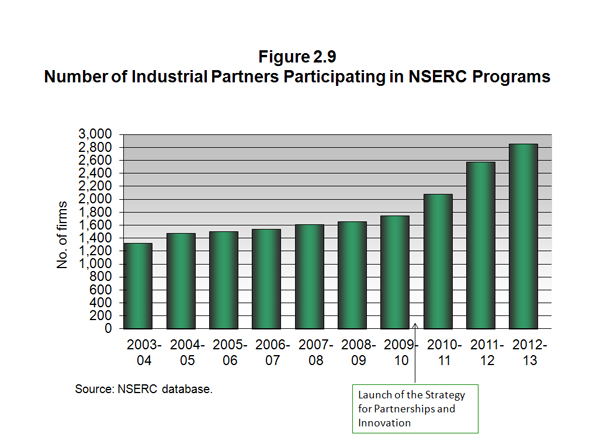
Number of Industrial Partners Participating in NSERC Programs
Program 3.1: Fund Research in Strategic Areas
| Total Budgetary Expenditures (Main Estimates) 201213 |
Planned Spending 201213 |
Total Authorities (available for use) 201213 |
Actual Spending (authorities used) 201213 |
Difference 201213 |
|---|---|---|---|---|
| 106.6 | 106.6 | 109.2 | 101.4 | -5.2 |
| Planned 2012-13 |
Actual 2012-13 |
Difference 2012-13 |
|---|---|---|
| 20 | 23 | 3 |
| Expected Results | Performance Indicators | Targets | Actual Results |
|---|---|---|---|
| Research and training in targeted and emerging areas of national importance is accelerated | Percentage of researchers applying for a strategic grant for the first time (or who have never applied in a specific area). | Five percent | 16 percent |
Performance Analysis and Lessons Learned
In 2012-13, there were 125 new applicants to NSERC's Strategic Project Grants corresponding to 16% of the total number of new applicants to the program (Figure 2.10).
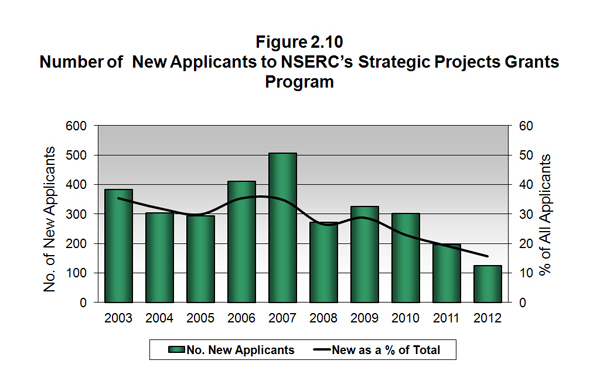
Number of New Applicants to NSERC's Strategic Projects Grants Program
Strategic Projects Grants: Strategic Project Grantsxxiii (SPG) fund early-stage research projects in targeted areas that could strongly enhance Canada's economy, society and/or environment within the next 10 years. In 2012-13, SPG grants included two collaborations with France and one with Japan, as a result of NSERC's international agreements for joint projects.
In 2012-13, NSERC also signed an agreement with the São Paulo Research Foundation (FAPESP) in Brazil, to jointly fund research projects conducted by teams in both countries. NSERC will fund Canadian researchers participating in these projects. A streamlined application process will allow researchers to complete a single application that will serve as the joint research project application. NSERC and FAPESP have also agreed to align programs that support international student training activities. Other calls for proposals have been launched for research collaborations with Taiwan, France and Japan.
Program Evaluation: Strategic Project Grants
An evaluation including a Partial Cost-Benefit Analysis of the Strategic Projects Grants (SPG) was completed in 2012-13 and found that the program has made a significant contribution to research in the target areas and the priorities of the ![]() Science and Technology Strategy. Without the program, approximately half of the projects would have likely not proceeded, and many projects would have been reduced in scope, often with less involvement from partners or Highly Qualified Personnel (HQP).
Science and Technology Strategy. Without the program, approximately half of the projects would have likely not proceeded, and many projects would have been reduced in scope, often with less involvement from partners or Highly Qualified Personnel (HQP).
The evaluation found that research results from Strategic projects are almost always transferred to partners. Strategic projects generated nearly twice the number of publications and conference presentations and a greater number of patent applications than non-funded projects. More than half of the project partners had also applied the project results for economic gain, to strengthen public policy, or to achieve other social or environmental benefits. One in twenty Strategic projects had led to the creation of a spin-off company. On average, Strategic projects trained 15 HQP, twice as many as non-funded projects. Sixty percent of the HQP reported that they were offered jobs or contracts as a result of their involvement with the projects and 90% of partners who had employed former HQP considered them to be more job-ready than other hires as a result of their participation in Strategic projects. Strategic project grants also had a sustainable impact on researchers' teaching activities in most cases.
The program was found to be efficient, since the administrative costs incurred to deliver the program are low, at only 5.2% of the total program costs. The Partial Cost-Benefit Analysis performed demonstrated that, in the most conservative analysis, the socio-economic benefits from only 5 (out of 262) projects would cover almost 60% of total program costs. In a less conservative analysis, it is likely that benefits from five Strategic projects would cover about 1.4 times total program costs.
Collaborative Health Research Projects: The transition of the administration of the Collaborative Health Research Projects (CHRP) initiative to the Canadian Institutes of Health Research, NSERC's partner, is on-going. In 2012-13, NSERC worked with CIHR to refine the program's guidelines and selection criteria for the 2012 competition, resulting in a stronger emphasis on end user partner involvement and stressing the role of science and engineering in CHRP projects. An evaluation of this program was launched in 2012-13.
Program 3.2: Fund University-Industry-Government Partnerships
| Total Budgetary Expenditures (Main Estimates) 201213 |
Planned Spending 201213 |
Total Authorities (available for use) 201213 |
Actual Spending (authorities used) 201213 |
Difference 201213 |
|---|---|---|---|---|
| 168.8 | 171.8 | 189.1 | 185.4 | 13.6 13 |
| Planned 2012-13 |
Actual 2012-13 |
Difference 2012-13 |
|---|---|---|
| 61 | 72 | 11 |
| Expected Results | Performance Indicators | Targets | Actual Results |
|---|---|---|---|
| Mutually beneficial collaborations between the private sector and researchers in universities, resulting in industrial or economic benefits to Canada. | Increase in the number of industrial partners supporting and participating in collaborations with university or college research teams. | Greater than 150 new partners. | 511 new partners |
| Partner satisfaction with research results. | 75 percent of partners indicating satisfaction through final reports and/or follow-up surveys. | 89 percent | |
| Percentage growth in partner contributions. | Greater than 5%. | Partner contributions grew by 10.1% in the latest fiscal year. |
Performance Analysis and Lessons Learned
According to the latest data available, the number of industrial partners participating in collaborations with university or college research teams increased by 511 new partners from 2010-11 to 2011-12. The number of industrial partners participating in these collaborations was 1,455 in 2011-12 and has been growing steadily since the launch of the Strategy for Partnerships and Innovation in 2009-10 (Figure 2.11). Interest in Engage Grants to establish new relationships between companies and college or university R&D personnel remains high.
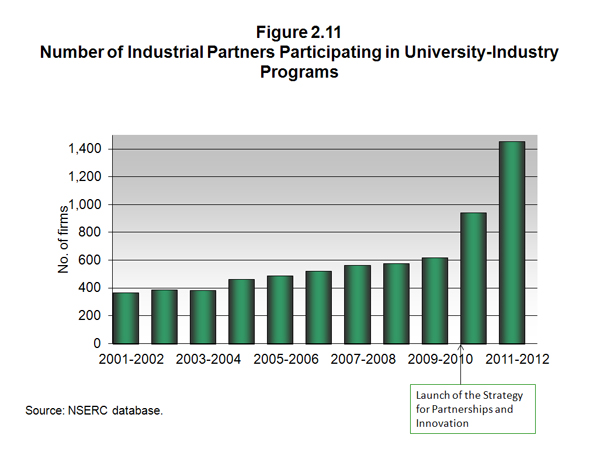
Number of Industrial Partners Participating in University-Industry Programs
In 2012-13, there was a 13.1 percentage growth in contributions from industrial partners for the Collaborative R&D (CRD) Grantsxxv. CRD Grants support well-defined projects undertaken by university researchers and their private-sector partners and are intended to give companies that operate from a Canadian base access to the unique knowledge, expertise, and educational resources available at Canadian postsecondary institutions, as well as to train students in essential technical skills required by industry. The mutually beneficial collaborations are expected to result in industrial and/or economic benefits to Canada by addressing challenges that are relevant to industry. The value that industrial partners place on these collaborations is evident from their contributions to the CRD program. Industry partners are leveraging funding having contributed on average 57% to CRD projects in the past 10 years, equivalent to over $ 75.7 million in 2012-13 (Figure 2.12).
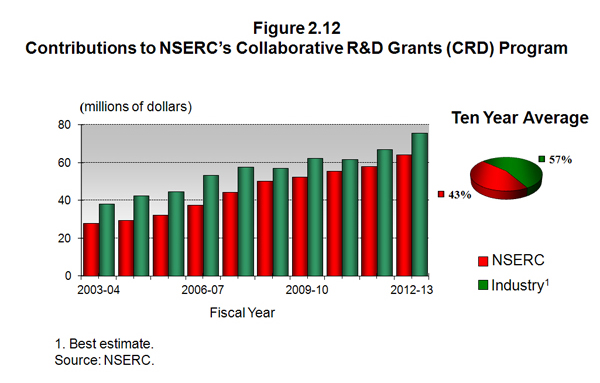
Contributions to NSERC's Collaborative R&D Grants (CRD) Program
In 2012-13, NSERC implemented an on-going pilot initiative with International Science and Technology Partnerships Canada. The first round of competitions has almost been completed and funding decisions are expected shortly. It is anticipated that NSERC will fund up to 13 Collaborative R&D proposals: seven with Brazil, five with India, and one with Israel, with estimated NSERC cash contributions of about $1.5 million dollars over 2 years. These projects will involve Canadian researchers and their business partners collaborating in joint research with their foreign counterparts.
CRD grants are part of a broader suite of university industry grants that encourage industry to benefit from the strengths of Canada's university research capability. Others include 165 Industrial Research Chairs held by high-calibre researchers across Canada who respond to industry needs over a long period, building capacity in key research areas and providing training to talent that end up transforming industries through innovation.
Canada-India Research Centre of Excellence: The Budget 2011 announced funding to establish a ![]() Canada-India Research Centre of Excellencexxvi (CIRCE), as part of the Government of Canada's wider India Engagement Strategy. The CIRCE competition, managed by the Networks of Centres of Excellence program, resulted in awarding funding of $13.8 million over five years to the India-Canada Centre for
Canada-India Research Centre of Excellencexxvi (CIRCE), as part of the Government of Canada's wider India Engagement Strategy. The CIRCE competition, managed by the Networks of Centres of Excellence program, resulted in awarding funding of $13.8 million over five years to the India-Canada Centre for ![]() India Canada for Innovative Multidisciplinary Partnerships to Accelerate Transformation and Sustainabilityxxvii (IC-IMPACTS). The new centre will focus on safe drinking water and reliable infrastructure, such as well-constructed hospitals and effective prevention and treatment of water-borne and infectious diseases.
India Canada for Innovative Multidisciplinary Partnerships to Accelerate Transformation and Sustainabilityxxvii (IC-IMPACTS). The new centre will focus on safe drinking water and reliable infrastructure, such as well-constructed hospitals and effective prevention and treatment of water-borne and infectious diseases.
Business-Led Networks of Centres of Excellence (BL-NCE): The ![]() Business-Led Networks of Centres of Excellencexxviii (BL-NCE) program was made permanent in the Budget 2012. The Networks of Centres of Excellence Secretariat, which administers the BL-NCE program, has run a competition for renewal of existing networks and is currently running a competition for new BL-NCEs that will begin operations in the spring of 2014.
Business-Led Networks of Centres of Excellencexxviii (BL-NCE) program was made permanent in the Budget 2012. The Networks of Centres of Excellence Secretariat, which administers the BL-NCE program, has run a competition for renewal of existing networks and is currently running a competition for new BL-NCEs that will begin operations in the spring of 2014.
Program Evaluation: Business-Led Networks Centres of Excellence
The first evaluation of the Business- Led Networks Centres of Excellence (BL-NCE) program was completed in 2012. The evaluation found that the program is aligned with federal government priorities set out in the S&T Strategy and the next phase of Canada's Economic Action Plan (Budget 2011) and that there is an ongoing need for this type of program which helps fill a gap in the innovation spectrum between proof of concept and product development.
The BL-NCE networks have implemented effective models and management practices to achieve outcomes. Overall, the evidence showed that the BL-NCE program has been efficient in managing its operational resources, particularly in comparison to other programs with larger grant funds.
The business-led model has encouraged the development of industry-university research partnerships as evidenced by 89 projects involving 378 researchers. The level of industry involvement in each BL-NCE network has ensured that research projects are driven by industry's needs.
Program 3.3: Support Commercialization
| Total Budgetary Expenditures (Main Estimates) 201213 |
Planned Spending 201213 |
Total Authorities (available for use) 201213 |
Actual Spending (authorities used) 201213 |
Difference 201213 |
|---|---|---|---|---|
| 42.9 | 42.9 | 52.4 | 50.9 | 8.0 |
| Planned 2012-13 |
Actual 2012-13 |
Difference 2012-13 |
|---|---|---|
| 19 | 21 | 2 |
| Expected Results | Performance Indicators | Targets | Actual Results |
|---|---|---|---|
| The transfer of knowledge and technology residing in Canadian universities and colleges to the user sector is facilitated | Percentage of projects that lead to successful commercialization including the creation of new spin-off companies and licensing agreements | Greater than 10%. | 29.4% |
Performance Analysis and Lessons Learned
NSERC's commercialization initiatives enhance the capacity of Canadian universities and colleges to transfer knowledge and technology from academic research laboratories to Canadian companies, and to accelerate the pre-commercial development of promising innovations. The percentage of Idea to Innovation projects that have resulted in commercial success, including the creation of new spin-off companies and licensing agreements, to date is 29.4%. This fraction will rise over the coming years, as it typically takes 3-5 years for commercial success to be observed from an Idea to Innovation funded-project.
College and Community Innovation: The objective of the College and Community Innovationxxix (CCI) Program is to increase innovation at the community and/or regional level by enabling Canadian colleges to increase their capacity to work with local companies, particularly small and medium-sized enterprises. The program supports applied research and collaborations that facilitate commercialization, technology transfer, adaptation and adoption of new technologies.
Budget 2011 provided new investments directed towards the establishment of two new grants under the CCI program: the Industrial Research Chairs for Collegesxxx and the College-University Idea to Innovation Grantsxxxi. These latter grants support joint college-university research and development projects with promising commercialization potential. In 2012-13, NSERC awarded 14 new Industrial Research Chairs for Colleges to support the development of longer term, business-focused, applied research programs at colleges and 8 new recipients of College-University Idea to Innovation Grants. Economic Action Plan 2013 provided a further $12 million per year to augment Canadian colleges' innovation capacity and their ability to respond to business R&D needs.
Program Evaluation: College and Community Innovation
An evaluation of the College and Community Innovation (CCI) program covering the period from the program's inception in 2007-08 to 2011-12, was completed in 2012. The evaluation found that the CCI program is achieving, or on track to achieve, its' expected immediate and intermediate outcomes.
The CCI program has contributed to increasing business R&D. In particular, the evaluation found that the IE Grant changed the nature and intensity of relationships colleges typically had with SMEs prior to the funding in terms of providing firms greater access to faculty, students, and college facilities. The majority of companies were satisfied with their interaction with the college (86%) and they plan to undertake a collaborative research project with the college in the future (69%).
A survey of partners found that more than two-thirds (69%) of companies had also experienced impacts on at least one aspect of their R&D capacity (i.e., either on their ability to (1) introduce new or substantially improved products, processes or services; (2) take them to market; (3) attract investments; or, (4) make research investments.)
Centres of Excellence for Commercialisation and Research: The ![]() Centres of Excellence for Commercialization and Research
xxxii (CECR) Program bridges the challenging gap between innovation and commercialization by funding centres that advance research and facilitate commercialization within the S&T priority areas.
Centres of Excellence for Commercialization and Research
xxxii (CECR) Program bridges the challenging gap between innovation and commercialization by funding centres that advance research and facilitate commercialization within the S&T priority areas.
The CECR program has placed an emphasis on stronger business planning to increase accountability and commercialization impacts. Four centres that demonstrated strong commercialization results were awarded $48 million in competition funding.
Program Evaluation: Centres of Excellence for Commercialization of Research
An evaluation of the Centres of Excellence for Commercialization and Research (CECR) program was completed in 2012 and found that the program is aligned with the priorities articulated in the federal S&T Strategy and that the program's commercialization focus addresses a gap in public research and development (R&D) funding.
The evaluation found that the CECR program has many strengths, including a high level of industry involvement in the program. The centre of excellence approach is consistent with innovation cluster approaches that have been used elsewhere to support innovation in areas of local or sectoral strength.
The CECR program has been successful in achieving many immediate and intermediate outcomes, including enhancing R&D and commercialization capacity, strengthening domestic collaboration and attracting investment from partners by leveraging $1.50 for every $1 of the CECR grants expended.
The CECR program has accelerated the commercialization of new technologies through strong intellectual property management, investment in new technologies and company creation. Centre partners have accessed support and commercialization expertise which have had organizational benefits for participants in terms of knowledge base and R&D capacity.
Following the evaluation, the CECR program has updated program elements, renewed its Terms and Conditions, and developed a competitive process for additional funds for existing centres, and is currently running a competition for new centres.
Program 4.1: Internal Services
| Total Budgetary Expenditures (Main Estimates) 201213 |
Planned Spending 201213 |
Total Authorities (available for use) 201213 |
Actual Spending (authorities used) 201213 |
Difference 201213 |
|---|---|---|---|---|
| 24.0 | 24.0 | 26.6 | 27.2 | 3.2 |
| Planned 2012-13 |
Actual 2012-13 |
Difference 2012-13 |
|---|---|---|
| 179 | 171 | -8 |
Performance Analysis and Lessons Learned
In 2012-13, NSERC continued to identify new opportunities to connect with external audiences by collaborating with other organizations and stakeholders to maximize the results of federal government investments in research and to showcase the impact of research on the lives of Canadians and Canada's economy.
Specific initiatives undertaken by NSERC in 2012-13 included: a Communications Day with communications departments at colleges and universities to better promote research impacts; supporting or leading over 120 announcements and third party events that celebrated major NSERC grant holders in their communities; working with the Social Sciences and Humanities Research Council and the Canadian Institutes of Health Research to implement the harmonized Canada Graduate Scholarships; presenting the ![]() Interim Progress Report on Strategy for Partnerships and Innovationxxxiii to different audiences to show the strong results achieved after 3 years of this initiative; and continuing to increase NSERC's outreach via social media.
Interim Progress Report on Strategy for Partnerships and Innovationxxxiii to different audiences to show the strong results achieved after 3 years of this initiative; and continuing to increase NSERC's outreach via social media.
NSERC's social media initiatives and successes in 2012-13 include reaching 10,000 Twitter followers, posting 20 videos on Facebookxxxiv, Twitterxxxv and the NSERC Web sitexxxvi to showcase NSERC-funded researchers, and daily tweeting and re-tweeting of NSERC-funded researcher news from institutions and third-parties to increase the awareness of publicly funded research impacts.
Integrated planning at NSERC was officially launched in September 2012 to promote collaboration amongst divisions across NSERC in developing and implementing the organization's corporate plan and priorities. The integrated planning process will promote further communication, collaboration and transparency internally and enhance internal responsibility and accountability by better linking NSERC's planning process to clear and relevant performance measures. This exercise also ensures that we are not missing any important opportunities to connect with our stakeholders.
Connecting with the research community across the country has been and will continue to be a key activity as NSERC seeks feedback and input on key programs and initiatives. NSERC will continue to proactively host engagement visits on campuses when opportunities arise, allowing us to gather feedback and advice from the community that benefits the most from NSERC's programs.
Section III: Supplementary Information
Financial Statements Highlights
Condensed Statement of Operations and Departmental Net Financial Position
| Natural Sciences and Engineering Research Council of Canada Condensed Statement of Operations and Departmental Net Financial Position (Unaudited) For the Year Ended March 31, 2013 ($ units) |
|||||
|---|---|---|---|---|---|
| 2012–13 Planned Results | 2012–13 Actual | 2011–12 Actual | $ Change (2012–13 Planned vs. Actual) | $ Change (2012–13 Actual vs. 2011–12 Actual) | |
| Total expenses | 1,056,706 | 1,073,115 | 1,091,918 | 16,409 | (18,803) |
| Total revenues | 0 | 0 | 0 | 0 | 0 |
| Net cost of operations before government funding and transfers | 1,056,706 | 1,073,115 | 1,091,918 | 16,409 | (18,803) |
| Departmental net financial position | 810 | 1,343 | (5,124) | 533 | 6,467 |
Description of Allocation of NSERC Expenses between Grants and Operating Expenses, 2012-13
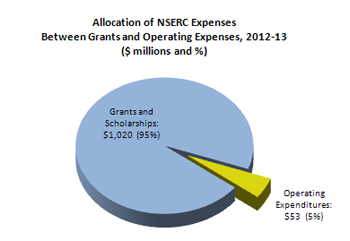
This pie chart shows the allocation of 2012-13 expenses by the Natural Sciences and Engineering Research Council of Canada (NSERC) for grants and scholarships and for operating expenses.
Grants and scholarships expenditures were 1,020 million dollars, or 95% of total NSERC expenses.
Operating expenditures were 53 million dollars, or 5% of total NSERC expenses.
Allocation of NSERC Expenses Between Grants and Operating Expenses
2012-13 ($ millions and %)
As illustrated above, NSERC allocates 95% of its available budget directly to researchers and institutions across Canada to support university- and college-based research and training in the natural sciences and engineering.
Condensed Statement of Financial Position
| Natural Sciences and Engineering Research Council of Canada Condensed Statement of Financial Position (Unaudited) As at March 31, 2013 ($ units) |
|||
|---|---|---|---|
| 2012–13 | 2011–12 | $ Change | |
| Total net liabilities | 7,433 | 12,106 | (4,673) |
| Total net financial assets | 4,045 | 4,296 | (251) |
| Departmental net debt | 3,388 | 7,810 | (4,422) |
| Total non-financial assets | 4,731 | 2,686 | 2,045 |
| Departmental net financial position | 1,343 | (5,124) | 6,467 |
Positive impact of 6.5 million dollars to the departmental net financial position due to the following:
- The decrease of 4.7 million dollars in total net liabilities is mainly due to the cease in accumulation of severance benefits under the employee severance pay program commencing in 2012 as part of terms and conditions negotiations with certain employee groups, and changes to conditions of employment for executives and certain non-represented employees.
- Increases in tangible capital assets were 1.9 million dollars due to an increase in assets under construction.
Financial Statements
- NSERC's Quarterly Financial Reportsxxxvii can be found on the NSERC Web site.
- NSERC's audited financial statements for the year ending March 31, 2013 can be found on NSERC's Web site: /NSERC-CRSNG/Reports-Rapports/plans-plans_eng.asp
- As part of its Financial Statements, NSERC publishes an Annex to the Statement of Management Responsibility Including Internal Control over Financial Reporting on its Web sitexxxviii.
Supplementary Information Tables
All electronic supplementary information tablesxxxiv listed in the 201213 Departmental Performance Report can be found on NSERC's Web site.
- Details on Transfer Payment Programs
- Greening Government Operations
- Internal Audits and Evaluations
Tax Expenditures and Evaluations Report
The tax system can be used to achieve public policy objectives through the application of special measures such as low tax rates, exemptions, deductions, deferrals and credits. The Department of Finance publishes cost estimates and projections for these measures annually in the ![]() Tax Expenditures and Evaluationsxi publication. The tax measures presented in the Tax Expenditures and Evaluations publication are the sole responsibility of the Minister of Finance.
Tax Expenditures and Evaluationsxi publication. The tax measures presented in the Tax Expenditures and Evaluations publication are the sole responsibility of the Minister of Finance.
Section IV: Other Items of Interest
Organizational Contact Information
For further information about this report, please contact:
Barney Laciak
Manager, Corporate Planning and Reporting
Natural Sciences and Engineering Research Council of Canada
Telephone: 613-996-1076
E-mail: barney.laciak@nserc-crsng.gc.ca
Endnotes
i ![]() Treasury Board of Canada 2012
Treasury Board of Canada 2012
ii ![]() Public Accounts of Canada 2012
Public Accounts of Canada 2012
iii Natural Sciences and Engineering Research Council of Canada 2012
iv Natural Sciences and Engineering Research Council of Canada 2012
v ![]() Gender Summit 3 North America 2013
Gender Summit 3 North America 2013
vi Natural Sciences and Engineering Research Council of Canada 2011
vii ![]() National Science Foundation 2013
National Science Foundation 2013
viii ![]() National Institutes of Health 2013
National Institutes of Health 2013
ix ![]() Consejo Nacional de Ciencia y Tecnología 2013
Consejo Nacional de Ciencia y Tecnología 2013
x ![]() Canadian Institutes of Health Research 2013
Canadian Institutes of Health Research 2013
xi ![]() Banting Postdoctoral Fellowships 2013
Banting Postdoctoral Fellowships 2013
xii ![]() Vanier Canada Graduate Scholarships 2013
Vanier Canada Graduate Scholarships 2013
xiii Natural Sciences and Engineering Research Council of Canada 2013
xvi ![]() Deutsche Forschungsgemeinschaft 2013
Deutsche Forschungsgemeinschaft 2013
xvii ![]() Fondacao de Amparo a Pesquisa do Estado de Sao Paulo 2013
Fondacao de Amparo a Pesquisa do Estado de Sao Paulo 2013
xviii Natural Sciences and Engineering Research Council of Canada 2012
xiv ![]() Council of Canadian Academies 2012
Council of Canadian Academies 2012
xx Natural Sciences and Engineering Research Council of Canada 2012
xxi ![]() Canada Foundation for Innovation 2013
Canada Foundation for Innovation 2013
xxii Natural Sciences and Engineering Research Council of Canada 2013
xxiii Natural Sciences and Engineering Research Council of Canada 2013
xxiv Natural Sciences and Engineering Research Council of Canada 2013
xxv Natural Sciences and Engineering Research Council of Canada 2013
xxvi ![]() Networks Centres of Excellence 2012
Networks Centres of Excellence 2012
xxvii ![]() IC-IMPACTS 2013
IC-IMPACTS 2013
xxviii ![]() Networks Centres of Excellence 2013
Networks Centres of Excellence 2013
xxiv Natural Sciences and Engineering Research Council of Canada 2013
xxx Natural Sciences and Engineering Research Council of Canada 2012
xxxi Natural Sciences and Engineering Research Council of Canada 2013
xxxii ![]() Networks Centres of Excellence 2012
Networks Centres of Excellence 2012
xxxiii ![]() NSERC Partnerships 2012
NSERC Partnerships 2012
xxxiv Facebook 2013
xxxv Twitter 2013
xxxvi Natural Sciences and Engineering Research Council of Canada 2011
xxxvii Natural Sciences and Engineering Research Council of Canada 2013
xxxviii Natural Sciences and Engineering Research Council of Canada 2013
xxxiv Natural Sciences and Engineering Research Council of Canada 2013
xxxx ![]() Finance Canada 2008
Finance Canada 2008
Footnotes
1 In 2011, Canada's three federal research agencies, CIHR, NSERC and SSHRC, jointly created the Panel on Responsible Conduct of Research (PRCR) as part of a collaborative objective of ensuring a coherent and uniform approach for promoting responsible conduct of research and for addressing allegations of breaches of Tri-Agency Policies, consistent with the Tri-Agency Framework: Responsible Conduct of Research. Several programs included in NSERC's Program Alignment Architecture involve two or more of the federal granting agencies, and are governed by tri-agency steering committees, such as the Networks Centres of Excellence (NCE) Steering Committee, chaired by the President of NSERC. (Currently the President of CIHR is the acting chair of the NCE steering committee).
2 Type is defined as follows: previously committed to—committed to in the first or second fiscal year prior to the subject year of the report; ongoing—committed to at least three fiscal years prior to the subject year of the report; and new—newly committed to in the reporting year of the RPP or DPR. If another type that is specific to the department is introduced, an explanation of its meaning must be provided.
3 In order to align with departmental authorities by Program, as presented in Vol. II of the Public Accounts, services provided without charge amounts for employer's contribution to employee insurance plans, such as the Public Service Health Care Plan and the Public Service Dental Plan provided by the Treasury Board of Canada Secretariat, accommodations provided by Public Works and Government Services Canada, Workers' compensation provided by Human Resources and Skills Development Canada and legal services provided by the Department of Justice are not to be included in this figure. This information is presented in Departmental Financial Statements only.
4 The spending figures may not match figures included in previous reports due to changes made to the Program Alignment Architecture (PAA) in 2012-13 that are being implemented for the first time in fiscal year 2013-14. These changes involve a reorganization of programs in NSERC's new PAA structure.
5 The spending figures may not match figures included in previous reports due to changes made to the Program Alignment Architecture (PAA) in 2012-13 that are being implemented for the first time in fiscal year 2013-14. These changes involve a reorganization of programs in NSERC's new PAA structure.
6 In order to align with departmental authorities by Program, as presented in Vol. II of the Public Accounts, services provided without charge amounts for employer's contribution to employee insurance plans, such as the Public Service Health Care Plan and the Public Service Dental Plan provided by the Treasury Board of Canada Secretariat, accommodations provided by Public Works and Government Services Canada, Workers' compensation provided by Human Resources and Skills Development Canada and legal services provided by the Department of Justice are not to be included in this figure. This information is presented in Departmental Financial Statements only.
7 Unused funds from other NSERC programs were transferred to Research Tools and Instruments under P.A. 2.2- Support for Research Equipment and Major Resources.
8 The spending figures may not match figures included in previous reports due to changes made to the Program Alignment Architecture (PAA) in 2012-13 that are being implemented for the first time in fiscal year 2013-14. These changes involve a reorganization of programs in NSERC's new PAA structure.
9 In order to align with departmental authorities by Program, as presented in Vol. II of the Public Accounts, services provided without charge amounts for employer's contribution to employee insurance plans, such as the Public Service Health Care Plan and the Public Service Dental Plan provided by the Treasury Board of Canada Secretariat, accommodations provided by Public Works and Government Services Canada, Workers' compensation provided by Human Resources and Skills Development Canada and legal services provided by the Department of Justice are not to be included in this figure. This information is presented in Departmental Financial Statements only.
10 This is the difference between planned spending for 2012-13 and the actual spending for 2012-13 (authorities used in that fiscal year).
11 The difference in planned and actual spending and FTEs is mainly due to the implementation of changes announced in Budget 2012. Differences also reflect that not all Canada Research Chairs may be filled at a given point, due to normal turnover of incumbents. Funds were redeployed through NSERC programming.
12 The number of FTEs includes a reallocation of resources due to the transfer of the Industrial Research Chairs to PAA Program element "Fund University-Industry Government Partnerships". The remaining low level of FTEs for this program (1 FTE) is explained by the fact that both the Canada Research Chairs and the Canada Excellence Research Chairs programs are managed through SSHRC.
13 Actual spending was higher than planned spending due to increased demand from industry for the Collaborative R&D initiative.
14 Actual spending was higher than planned spending due to increased demand from industry for the Collaborative R&D initiative.
15 The actual number of FTEs includes a reallocation of resources due to the transfer of the Industrial Research Chairs from Program "Attract and Retain Faculty"