
Natural Sciences and Engineering Research Council of Canada
www.nserc-crsng.gc.ca
Common menu bar links
Natural Sciences and Engineering Research Council of Canada Quarterly Financial Report for the quarter ended December 31, 2019
Statement outlining results, risks and significant changes in operations, personnel and programs
![]() NSERC Quarterly Financial Report 3rd Quarter, December 2019
NSERC Quarterly Financial Report 3rd Quarter, December 2019
- Introduction
- Highlights of fiscal quarter and fiscal year-to-date results
- Risks and uncertainties
- Significant changes related to operations, personnel and programs
- Statement of authorities (unaudited)
- Departmental budgetary expenditures by standard object (unaudited)
Introduction
This Quarterly Financial Report (QFR) has been prepared by management as required by section 65.1 of the ![]() Financial Administration Act (FAA), and in the form and manner prescribed by the Treasury Board. It should be read in conjunction with the 2019–20
Financial Administration Act (FAA), and in the form and manner prescribed by the Treasury Board. It should be read in conjunction with the 2019–20 ![]() Main Estimates. This report has not been subject to an external audit or review.
Main Estimates. This report has not been subject to an external audit or review.
Authority, mandate and programs
The Natural Sciences and Engineering Research Council of Canada (NSERC) was established in 1978 by the Natural Sciences and Engineering Research Council Act and is a departmental corporation named in Schedule II of the FAA. NSERC’s purpose is to help make Canada a country of discoverers and innovators for the benefit of all Canadians, by supporting post-secondary students and postdoctoral fellows in their advanced studies, promoting discovery by funding the research programs of academic researchers, and stimulating partnerships between academia and industry.
Further information on the NSERC mandate and program activities can be found in ![]() Part II of the Main Estimates.
Part II of the Main Estimates.
Basis of presentation
Management prepared this quarterly report using an expenditure basis of accounting. The accompanying Statement of Authorities includes NSERC’s spending authorities granted by Parliament and those used by the agency, consistent with the Main Estimates for fiscal year 2019–20. This quarterly report has been prepared using a special-purpose financial reporting framework designed to meet financial information needs with respect to the use of spending authorities.
The authority of Parliament is required before the Government of Canada can spend monies. Approvals are given in the form of annually approved limits through appropriation acts or through legislation in the form of statutory spending authorities for specific purposes.
NSERC uses the full accrual method of accounting to prepare and present its annual financial statements that are part of the departmental results reporting process. However, the spending authorities voted by Parliament remain on an expenditure basis.
Highlights of fiscal quarter and fiscal year-to-date results
This section highlights the significant items that contributed to the change in resources available for the fiscal year, as well as the actual year-to-date and quarterly expenditures compared with the previous fiscal year.
The following graph provides a comparison of budgetary authorities available for the full fiscal year and budgetary expenditures by quarter for fiscal year 2019–20 and fiscal year 2018–19.
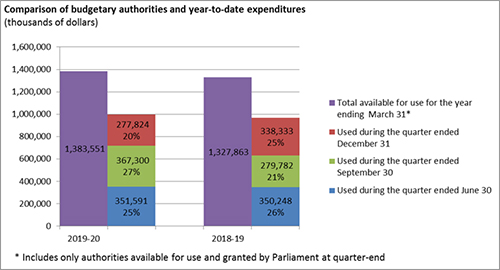
Comparison of budgetary authorities and year-to-date expenditures
Significant changes to budgetary authorities
As of December 31, 2019, NSERC’s total available authorities for fiscal year 2019–20 amounted to $1,383.6 million. This represents an overall increase of $55.7 million (4.2%) from the comparative period of the previous year. Of the $55.7 million, $50.0 million relates to increases in NSERC’s grant and scholarship programs (Vote 5), $5.0 million relates to increases in operating expenditures (Vote 1) and $0.7 million relates to increases in budgetary statutory authorities (Employee Benefit Plan). The major changes in NSERC’s budgetary authorities between the current and previous fiscal years include:
- an increase of $14.5 million from Budget 2018 for fundamental research;
- an increase of $8.3 million from Budget 2018 for the Colleges and Community Innovation program suite;
- an increase of $7.8 million to fund the 2018 Centres of Excellence for Commercialization and Research competition;
- an increase of $7.5 million from Budget 2018 for the Canada Research Chairs program;
- an increase of $7.2 million from Budget 2018 for the Canada Excellence Research Chairs program;
- an increase of $6.1 million from Budget 2019 for additional Canada Graduate Student awards and for coverage of the expanded duration of paid parental leave; and
- an increase of $3.0 million for the Canada 150 competition.
Significant changes to authorities used
Year-to-date spending
The following table provides a comparison of cumulative spending by vote for the current and previous fiscal years.
| Year-to-date budgetary expenditures used at quarter-end (millions of dollars) |
2019-20 | 2018-19 | Variance |
|---|---|---|---|
| Vote 1 - Operating expenditures | |||
| Personnel | 35.7 | 32.2 | 3.5 |
| Non-personnel | 8.6 | 6.0 | 2.6 |
| Vote 5 - Grants and scholarships | 952.4 | 930.1 | 22.3 |
| Total budgetary expenditures | 996.7 | 968.3 | 28.4 |
Total budgetary expenditures amounted to $996.7 million at the end of the third quarter of fiscal year 2019–20, compared to $968.3 million reported in the same period in the previous fiscal year.
Grants and scholarships:
At the end of the third quarter of 2019–20, the grant and scholarship expenses increased by $22.3 million, compared to what was reported in the same period of the previous fiscal year. The differences are attributable to the following:
- an increase of $31.9 million for the Discovery suite of programs, due to the increased authorities from Budget 2018;
- a net increase of $12.7 million, due to timing differences in payments;
- an increase of $9.8 million for the Canada Research Chairs program, due to the increased authorities from Budget 2018;
- an increase of $6.4 million for the Centres of Excellence for Commercialization and Research program, due to the new funds for the 2018 competition; and
- a cumulative decrease of $38.5 million due to the sunsetting of most Research Partnership programs, which will be partially offset by spending on the new Alliance program in Q4.
Operating expenditures:
Personnel expenditures have increased by $3.5 million compared to the same period in fiscal year 2018–19. This increase is mainly due to additional full-time employees (FTEs) hired related to Budget 2018 implementation and the Tri-Agency Grants Management Solution project.
Non-personnel expenditures have increased by $2.6 million, mainly due to increased spending on professional services related to the Tri-Agency Grants Management Solution project and the acquisition of office equipment and computers for new employees.
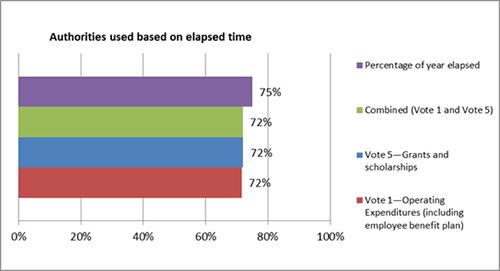
Authorities used based on elapsed time
The total authorities used during the third quarter ($277.9 million) of fiscal year 2019–20 represent 20% of total available authorities ($1,383.6 million).
Quarterly spending
The total authorities used during the third quarter of 2019–20 amounted to $277.9 million (20% of the total available authorities, 20% of the total authorities for grant and scholarship programs, and 24% of the total authorities for operating expenditures and employee benefits).
| Year-to-date budgetary expenditures used at quarter-end (millions of dollars) |
2019-20 | 2018-19 | Variance |
|---|---|---|---|
| Vote 1 - Operating expenditures | |||
| Personnel | 11.6 | 11.1 | 0.5 |
| Non-personnel | 3.1 | 2.4 | 0.7 |
| Vote 5 - Grants and scholarships | 263.2 | 324.9 | (61.7) |
| Total budgetary expenditures | 277.9 | 338.4 | (60.5) |
Grants and scholarships:
Transfer payments represent 95.5% of NSERC’s available authorities. Variances in transfer payments stem from the nature of program cycles. During the third quarter of 2019–20, NSERC’s transfer payment expenditures decreased by $61.7 million compared to the same quarter of the previous fiscal year, resulting from the following:
- a net decrease of $77.5 million due to timing differences in payments; and
- an increase of $15.8 million for the Discovery suite of programs, due to the increased authorities from Budget 2018.
Operating expenditures:
Personnel expenditures for the third quarter of fiscal year 2019–20 have increased by $0.5 million, mainly due to additional FTEs.
Non-personnel expenditures have increased by $0.7 million, mainly due to increased spending in professional services related to the Tri-Agency Grants Management Solution project.
Risks and uncertainties
Through an annual exercise, NSERC identifies corporate-level risks and develops response measures to minimize their likelihood and/or impact. Senior management closely monitors the top two risks (below) to ensure they are continuously mitigated and that the residual risk level is acceptable.
Operational risk 1—Interagency coordination: There is a risk that interagency alignment and coordination activities are insufficient to ensure appropriate governance of priority areas, harmonize program portfolios and address business process dependencies.
The federal government has directed NSERC to improve interagency coordination. Certain stakeholders (e.g., universities and some researchers) have also expressed a desire for increased coordination. Corporate projects need to be rolled out in a short timeframe, and this must be supported by an appropriate governance structure and clear decision-making process that views resources collectively. There are varying decision-making processes, mindsets and strategic directions. There is a lack of clarity around interagency governance structure and related processes. The fact that there are now two vice-president committees has created potential for confusion on scope/roles, as well as coordination challenges. Multiple interagency committees and working groups also create coordination challenges. NSERC is working on the implementation of the Tri-agency Governance plan, including measures to better coordinate across agencies.
Operational risk 2—Project management: There is a risk that key projects will not deliver intended benefits on time and within budget.
NSERC lacks an enterprise-wide project management approach and a corporate planning process that consider the resource requirements, dependencies and timelines of all projects together. NSERC lacks the capacity to coordinate multiple complex projects (e.g., Gateway, SAP, upcoming office move, etc.) NSERC will increase its project management maturity, establish a coordinating Portfolio Management/Change Management Office for projects that affect both agencies, and continually improve internal and interagency governance and decision-making structures. NSERC is undertaking a more rigorous approach to corporate planning that is linked to full costing, resource management and priority setting.
Significant changes related to operations, personnel and programs
The transition to NSERC’s new president, Dr. Alejandro Adem, continues. A new 2021–25 Strategic Plan is being developed.
NSERC continues to roll out the Alliance program and to implement an ambitious set of changes to the Discovery Grant and Scholarships programs, from Budgets 2018 and 2019.
Following the fall federal election, a new Cabinet was sworn in on November 20, 2019. The Honourable Navdeep Bains was reappointed Minister for Innovation, Science and Industry. Science no longer has a separate minister but it is integrated within Minister Bain’s broader mandate.
Approved by:
Original signed by
Dr. Alejandro Adem
President
Ottawa, Canada
February 28, 2020
Original signed by
Patricia Sauvé-McCuan
Vice-President and Chief
Financial Officer, NSERC
Statement of authorities (unaudited)
| Fiscal Year 2019-20 (in thousands of dollars) | ||||||
|---|---|---|---|---|---|---|
| Total available for use for the year ending March 31, 2020* | Used during the quarter ended December 31, 2019 | Year-to-date used at quarter-end | ||||
| Vote 1—Operating expenditures |
55,851 | 13,162 | 39,791 | |||
| Vote 5—Grants and scholarships | 1,321,516 | 263,167 | 952,438 | |||
| Budgetary statutory authorities | ||||||
| Contributions to the employee benefit plan | 6,005 | 1,495 | 4,486 | |||
| Spending of revenues pursuant to subsection 4(2) of the Natural Sciences and Engineering Research Council Act | 179 | - | - | |||
| Total budgetary authorities | 1,383,551 | 277,824 | 996,715 | |||
| * Includes only authorities available for use and granted by Parliament at quarter-end. | ||||||
| Fiscal Year 2018-19 (in thousands of dollars) | ||||||
|---|---|---|---|---|---|---|
| Total available for use for the year ending March 31, 2019* | Used during the quarter ended December 31, 2018 | Year-to-date used at quarter-end | ||||
| Vote 1—Operating expenditures |
50,860 | 12,114 | 34,285 | |||
| Vote 5—Grants and scholarships | 1,271,553 | 324,901 | 930,125 | |||
| Budgetary statutory authorities | ||||||
| Contributions to the employee benefit plan | 5,271 | 1,318 | 3,953 | |||
| Spending of revenues pursuant to subsection 4(2) of the Natural Sciences and Engineering Research Council Act | 179 | - | - | |||
| Total budgetary authorities | 1,327,863 | 338,333 | 968,363 | |||
| * Includes only authorities available for use and granted by Parliament at quarter-end. | ||||||
Departmental budgetary expenditures by standard object (unaudited)
| Fiscal Year 2019-20 (in thousands of dollars) | |||
|---|---|---|---|
| Planned expenditures for the year ending March 31, 2020 |
Expended during the quarter ended December 31, 2019 |
Year-to-date used at quarter-end | |
| Expenditures | |||
| Personnel | 46,133 | 11,578 | 35,690 |
| Transportation and communications | 4,795 | 714 | 1,680 |
| Information | 2,121 | 157 | 449 |
| Professional and special services | 5,875 | 1,827 | 4,432 |
| Rentals | 1,384 | 331 | 1,021 |
| Repair and maintenance | 239 | 19 | 95 |
| Utilities, materials and supplies | 192 | (9) | 77 |
| Acquisition of machinery and equipment | 1,296 | 39 | 833 |
| Acquisition of land, buildings and works | - | 1 | 1 |
| Other subsidies and payments | - | - | (1) |
| Transfer payments | 1,321,516 | 263,167 | 952,438 |
| Total budgetary expenditures | 1,383,551 | 277,824 | 996,715 |
| Fiscal Year 2018-19 (in thousands of dollars) | |||
|---|---|---|---|
| Planned expenditures for the year ending March 31, 2019 |
Expended during the quarter ended December 31, 2018 |
Year-to-date used at quarter-end | |
| Expenditures | |||
| Personnel | 41,559 | 11,056 | 32,195 |
| Transportation and communications | 4,555 | 613 | 1,650 |
| Information | 2,219 | 211 | 561 |
| Professional and special services | 5,435 | 946 | 2,386 |
| Rentals | 1,358 | 275 | 781 |
| Repair and maintenance | 123 | 21 | 60 |
| Utilities, materials and supplies | 205 | 52 | 170 |
| Acquisition of machinery and equipment | 856 | 258 | 435 |
| Acquisition of land, buildings and works | - | - | - |
| Other subsidies and payments | - | - | - |
| Transfer payments | 1,271,553 | 324,901 | 930,125 |
| Total budgetary expenditures | 1,327,863 | 338,333 | 968,363 |